Hello!
One of the nice things about Woocommerce is that it is very easily customized. Actions can be removed and re-added in order to adjust the default behavior. Additionally you can override many of the default templates that come with Woocommerce and its many extensions to fine tune and adjust the way you want your e-commerce to behave.
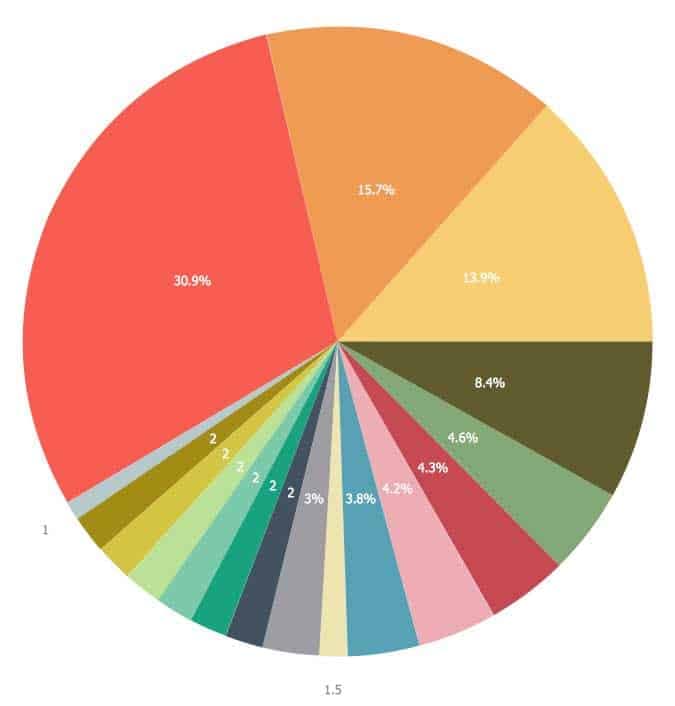
Whether you are selling t-shirts or auto parts, sometimes its nice to have a clean visual representation of the statistics of each of your products. This will allow the customer to easily attain the pertinent information that they may be looking for, perhaps even assisting in leading them into an online sale.
One of the best javascript libraries out there for “charting” is Chart.js. It is very simple yet extremely flexible for plotting and drawing visual representations of data. Things like chart colors, borders and a responsive layout are all things that come out of the box with Chart.js
So what if you wanted to have a standardized bar chart for each of your products that automatically shows up on the single product page? Since Chart.js is a javascript library, it would need to be integrated with WordPress and would have to be triggered in a dynamic way with data entered on the Woocommerce administrative side. I’ll try to walk you through how we accomplished this relatively straightforward feat step by step!
Create custom fields for Woocommerce products to hold the data
This doesn’t really need to be done as a first step, but is ideal because structuring your data first within Woocommerce will allow you to have a better handle of how to dynamically pull and represent it when you get to the later steps.
There are many ways to create custom fields for Woocommerce products, but one of the easiest and well-documented ways would be to use Advanced Custom Fields. ACF has a free (no trial) version of their plugin that should be good enough for this demonstration.
I should note that we used the premium version of ACF because we wanted to implement a repeater field. This was because we wanted to give the end-user the option to add as many chart elements as they wanted. Not 100% necessary, but without the premium plugin you’ll simply have to add something like 10 fixed fields for the end-user to enter. The code for pulling the fixed fields would be a bit different, but we’ll get into that during the next few steps.
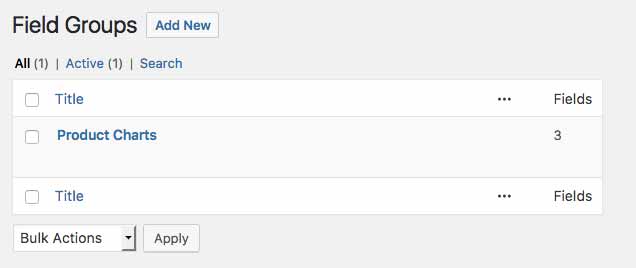
With ACF, there is again a lot of very well-written documentation on how to use it. As indicated in the screenshot above, we simply want to create a new field group of fields and assign it to the post type “products” (Woocommerce products) :
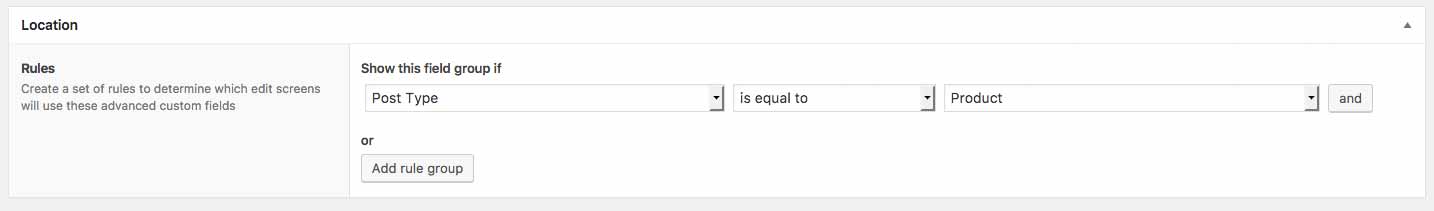
As far as what fields to add, for Chart.js the data needs to be represented as numeric values. What I would suggest is adding two fields for each data set : A text label and Data (numeric). This is because we want to have the labels represented in the Chart as a legend or tooltip. The numeric value would be a number that the user enters to be represented in the Chart (i.e. a pie chart, bar graph, etc).
Integrate Chart.js into WordPress
This part is pretty striaghtforward. We want to load the Chart.js library in WordPress so that we can use it! The way we chose to integrate it was by using the wp_enqueue_script function to load the CDN url for the library :
/* Custom Scripts to load */
function custom_scripts() {
    wp_enqueue_script( 'chart-js', 'https://cdnjs.cloudflare.com/ajax/libs/Chart.js/2.6.0/Chart.min.js', array(), true );
}
add_action( 'wp_enqueue_scripts', 'custom_scripts');
To get the latest Chart.js CDN library URL , you can visit this link.
Modify Woocommerce template to display Chart.js data for every product
In order to inject the Chart.js bar graph that we want to display, we need to be able to edit the content-single-product.php file. Rather than editing the template file in the Woocommerce plugin directory, we follow the best practice method of copying it to our theme folder, within the woocommerce sub directory (something like wp-content/themes/your-theme/woocommerce/content-single-product.php).
For us , we wanted the charts to display after the product description. You can decide where you want it to live based on your own requirements. You can inject the code to generate the charts within the content-single-product.php file and perhaps position/style it further within your templates CSS stylesheet. Ideally you should contain the code with a main container to make controlling the width and alignment easier.
if ( have_rows('usagestats') {
// Container and unordered list
echo '
// clear arrays
$usage_stats = array();
// Build dimension stat chart data
while( have_rows('dimensionstats') ) {
the_row();
$usage_stats[] = array(
'field_name' => get_sub_field('usage_field_name'),
'field_value' => get_sub_field('usage_field_value'),
);
}
What are we doing here? Well first thing is we want to check if there is any data entered for the ACF repeater field, which we called “usagestats”. This graph will be a bar graph that will itemize the different uses for the particular product we are selling (i.e. a broom used at home versus used in warehouses, etc).
Next we make sure to encompass everything in a div container, which we called “productchart-container”. We then create a while-loop to build an array called usage_stats that will get the values for the label and value fields. We will use this array when injecting the data into the Chart.js code that will build the actual chart!
// Clear & Build Data
$u_label = $u_data = null;
foreach($usage_stats as $key=>$item) {
$u_label .= '"' . $item['field_name'].'",';
$u_data .= $item['field_value'] . ',';
}
rtrim($u_label, ',');
rtrim($u_data, ',');
As indicated in the above example, we want to take the array we recently built and re-format it in a syntax that can easily be injected into the Chart.js code. This is important because we ant to generate standardized Chart.js javascript code on each page, but with the data thats relevant to that product! This means that if we take the recently formatted u_label and u_data fields, we can simply inject it in the javascript code that we will build.
$chart_tabs[] = array(
'tab_name' => 'Usage Stats',
'tab_content' => ' ',
'tab_js' => '',
);
Whats going on in the above snippet? We are creating an array called chart_tabs! You dont really need to do it this way, especially if you only want one chart generated on your product page. For us we wanted multiple charts that people could flip back-and-forth with using CSS tabs, so it made sense for us to build an array. You could easily simply assign the array keys to variables instead of using an array as indicated above.
The key thing to note is what we’re assigning to the array. We assign a tab_name , which really is just the name of the chart. We then assign a canvas to the tab_content key, which is what Chart.js uses to inject the chart onto the page.
The most important thing to note here is the data we assigned to the tab_js key. We are using the examples provided in the Chart.js documentation to generate the javascript code. You can see that we are injecting the u_label and u_data variables.
The last thing we need to do is actually echo the prepared code and variables!
$count = 0;
foreach ($chart_tabs as $chart_tab) {
$current = ($count == 0 ? 'current' : null);
echo '' . $chart_tab["tab_content"] . '';
echo $chart_tab["tab_js"];
$count++;
}
As a result of us needing the data in an array (chart_tabs), we need to generate the content in a foreach loop. Again this might not be necessary for you, especially if you are using the free version of the ACF plugin and only have a finite number of fields. The key is that we are generating the content within another div container (not 100% necessary), with the tab_content field. This is the canvas that the Chart.js library uses to inject the chart.
Lastly, we inject the tab_js code generated above! Feel free to modify the strategies outlined above to generate custom graphs and charts for your Woocommerce single product pages!


At Shift8, we cater to all sorts of businesses in and around Toronto from small, medium, large and enterprise projects. We are comfortable adapting to your existing processes and try our best to compliment communication and collaboration to the point where every step of the way is as efficient as possible.
Our projects are typically broken into 5 or 6 key “milestones” which focus heavily on the design collaboration in the early stages. We mock-up any interactive or unique page within your new website so that you get a clear picture of exactly how your design vision will be translated into a functional website.
Using tools like Basecamp and Redpen, we try to make the process simple yet fun and effective. We will revise your vision as many times as necessary until you are 100% happy, before moving to the functional, content integration and development phases of the project.
For the projects that are more development heavy, we make sure a considerable amount of effort is spent in the preliminary stages of project planning. We strongly believe that full transparency with a project development plan ensures that expectations are met on both sides between us and the client. We want to ensure that the project is broken into intelligent phases with accurate budgetary and timeline breakdowns.
Approved design mock-ups get translated into a browse-ready project site where we revise again and again until you are satisfied. Client satisfaction is our lifeblood and main motivation. We aren’t happy until you are.
Need Web Design?
Fill out the form to get a free consultation.
shift8 web toronto – 416-479-0685
203A-116 geary ave. toronto, on M6H 4H1, Canada
© 2023. All Rights Reserved by Star Dot Hosting Inc.
contact us
phone: 416-479-0685
toll free: 1-866-932-9083 (press 1)
email: sales@shift8web.com