Hello!
There was a scenario not too long ago where we were required to create a heatmap layer on top of a Google map to plot latitude/longitude coordinates. I thought I’d share the process through which we pull the coordinate data from a MySQL database and plot it into the google map as a heatmap layer.
We chose to go with a pre-built jQuery library to handle most of the work interacting with the Google Map api and drawing the heatmap layer itself. For this we chose heatmap.js. From heatmap.js’ website, it is a “lightweight, easy to use JavaScript library to help you visualize your three dimensional data!”.
What we’re ultimately trying to do is build a simple PHP page that pulls all the coordinate from a MySQL table, prepares it into a json array and then plots all the points as a heatmap over top a google map location.
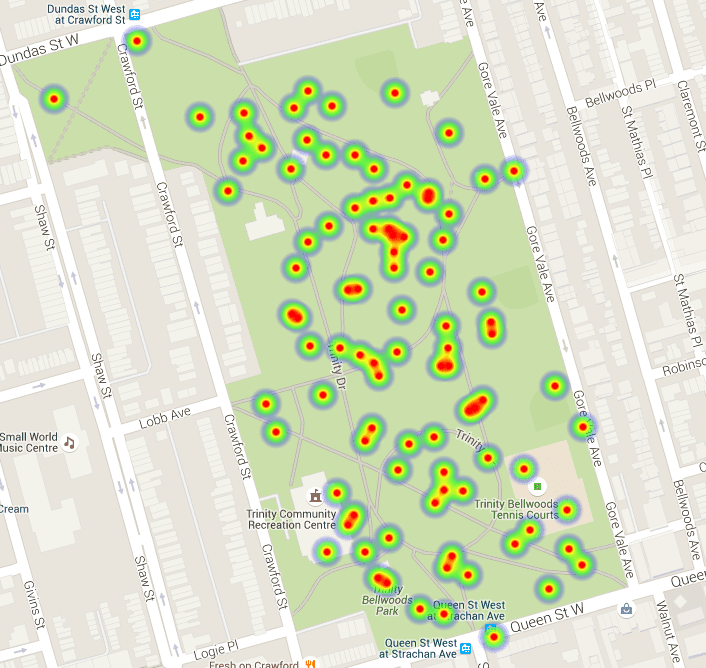
The location we chose was Trinity Bellwoods in Toronto. We want to plot a bunch of reported coordinate points on the map so you can see heavily “reported” areas in the park in such a way that you can visually discern areas of the park that are more reported than others.
Pull the data from MySQL
This is obvious! What we want to do is build a simple data array by completing a MySQL query against our database. Here is the SQL query that we will be using :
$sql = "SELECT latitude,longitude from reports order by created_at DESC;";
Simple, right? Well lets take that to the next step and connect to our database and execute the query :
    try {
        $db = connect_db();
                $result = $db->query($sql);
        while ( $row = $result->fetch_array(MYSQLI_ASSOC) ) {
                    $data[] = $row;
                }
        $db = NULL;
                $data_json = json_encode($data);
    } catch(PDOException $e) {
            echo '{"error":{"text":'. $e->getMessage() .'}}';
        }
If you echo the $data_json variable, you’ll likely see something like this :
{"latitude":"45.646008","longitude":"-59.414391"},{"latitude":"33.647446","longitude":"-49.413498"},{"latitude":"13.664890","longitude":"-88.420975"} ..
The heatmap.js library is capable of taking an additional integer to weight each plotted coordinate as a “count”. If you are able to count existing coordinates and then mark the duplicates with a count(*). As implied, the count variable will add weight to each coordinate that is greater than one. So if you have a coordinate that was reported 10 times, then it will appear more pronounced in the heatmap overlay.
Use Heatmap.js to build and plot the map
The heatmap.js library provides quite a few examples, including an example to interact directly with Google maps for your heatmap. I will walk you through creating the heatmap page. First you’ll want to load the libraries :
Next thing you want to do is create a div container for the map canvas. This should be full height / width on the screen, but can be adjusted through CSS to accommodate whatever layout you’re looking for.
Below the map canvas is where most of the manipulation happens. The first thing you want to do is declare the focal point of your map. In our case it is Trinity Bellwoods park in Toronto.
var myLatlng = new google.maps.LatLng(43.648062, -79.414115);
As far as how zoomed out we want to be, we pass standard google map options :
        var myOptions = {
          zoom: 17,
          center: myLatlng
        };
The heatmap library takes options with respect to scale, radius, and which fields to parse for latitude, longitude and count in the data variable.
        heatmap = new HeatmapOverlay(map,
          {
            // radius should be small ONLY if scaleRadius is true (or small radius is intended)
            "radius": 17,
            "maxOpacity": 1,
            // scales the radius based on map zoom
            "scaleRadius": false,
            // if set to false the heatmap uses the global maximum for colorization
            // if activated: uses the data maximum within the current map boundaries.
            //   (there will always be a red spot with useLocalExtremas true)
            "useLocalExtrema": true,
            // which field name in your data represents the lat - default "lat"
            latField: 'latitude',
            // which field name in your data represents the lng - default "lng"
            lngField: 'longitude',
            // which field name in your data represents the data value - default "value"
            valueField: 'count'
          }
        );
The in-line comments should help explain what each field is used for. Typically the default options should be good enough for first-time use. Finally we want to prep the testData variable which will contain the data array that we prepped with the PHP/MySQL query :
        var testData = {
          max: 8,
          data :
        };
You can see that I am simply echoing the $data_json variable via php. Now the last thing we need to do is trigger the heatmap :
heatmap.setData(testData);
If everything goes well, you’ll have a working heatmap!


